Timeseries SVG: A Chart & Sparkline Rendering Harness


![]()
Server-side SVG rendering for deterministic sparklines, trend charts, bar charts, and sliceable time-series visualizations — built for trading dashboards, SSR applications, reports, APIs, and LLM/Agentic workflows.
Need to add sparklines, trend lines, mini charts, bar charts, or slicable time-series charts to your application, dashboard, or LLM/Agentic workflows?
timeseries-sparklines is a lightweight server-side SVG rendering harness for sparklines, bar charts, and SVG time-series charts that can be sliced by days, weeks, months, years, or custom time windows.
It produces deterministic SVG markup that the browser can simply display - no chart initialization, no canvas lifecycle management, and no frontend chart runtime required.
pip install timeseries-sparklines
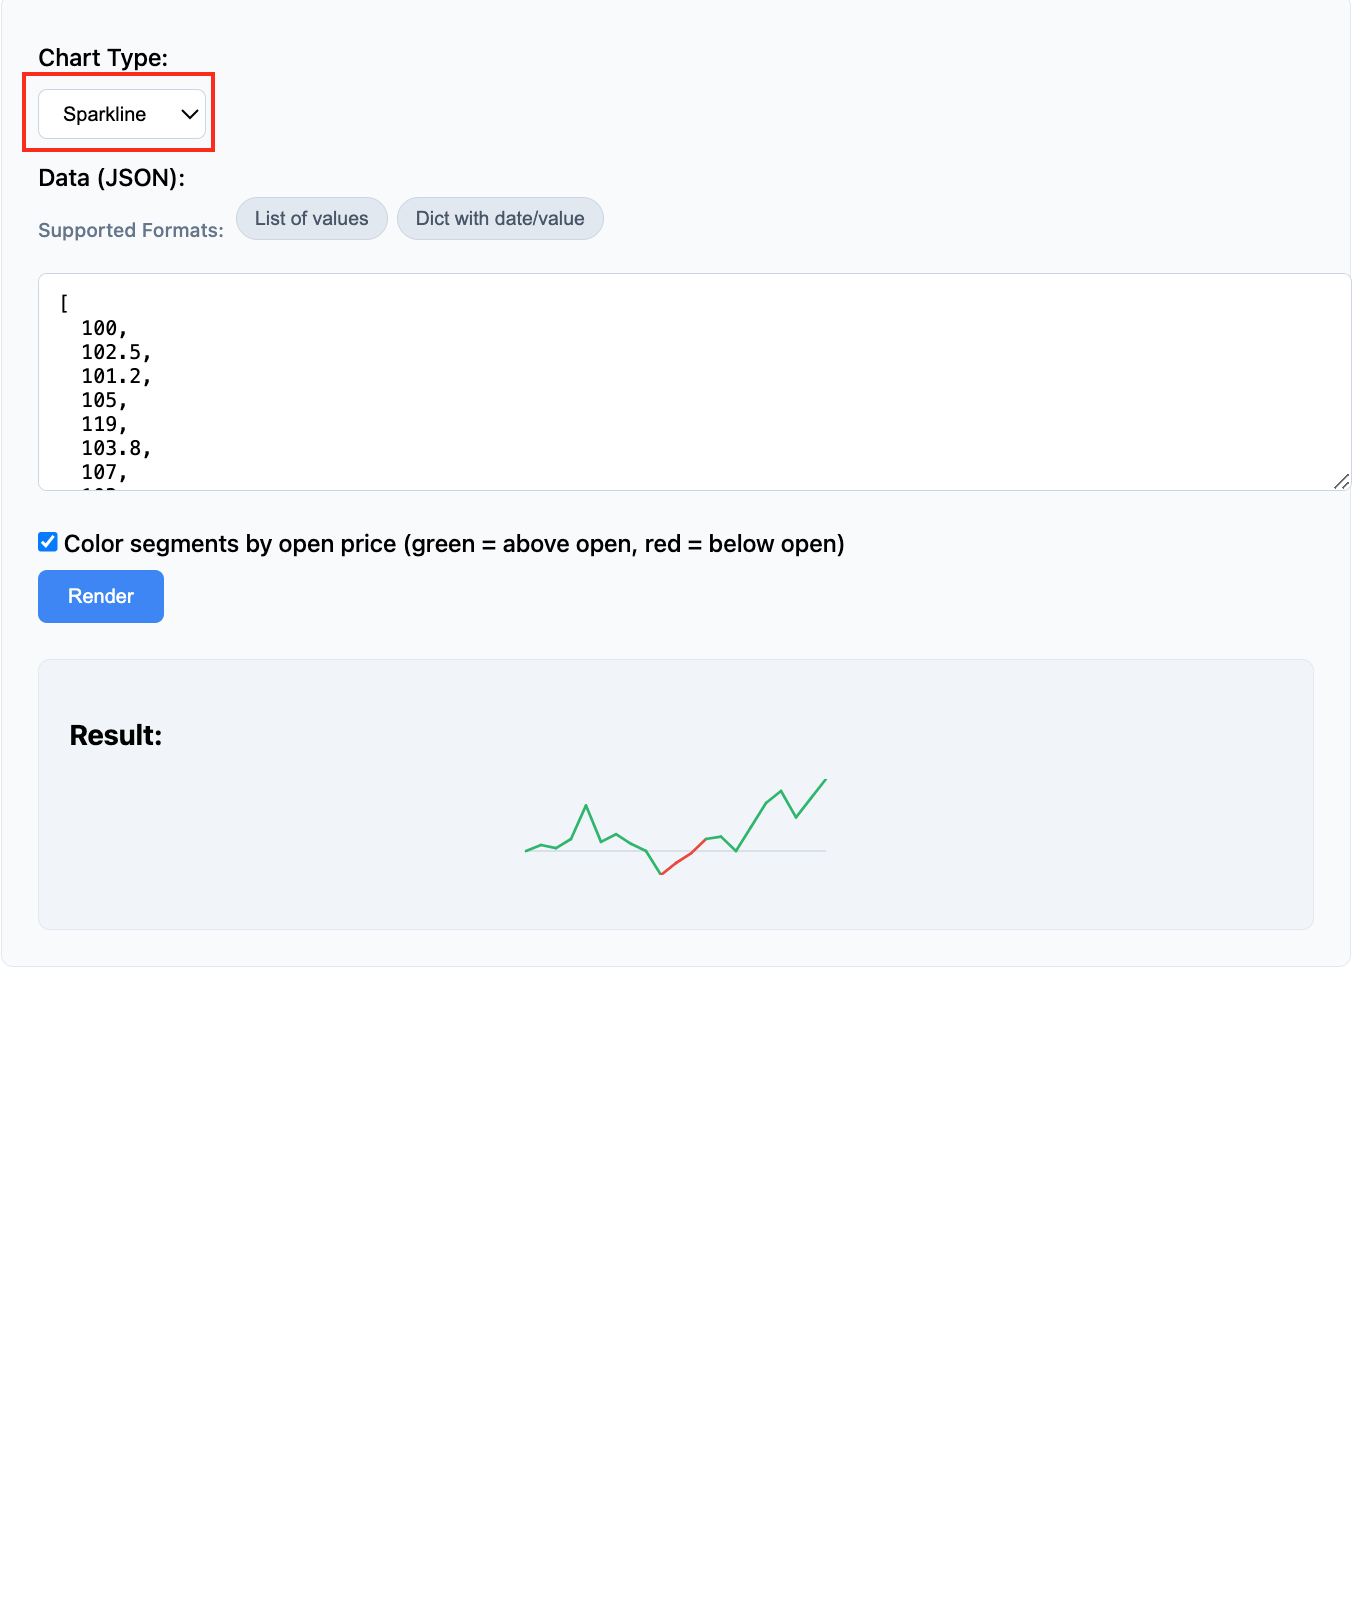
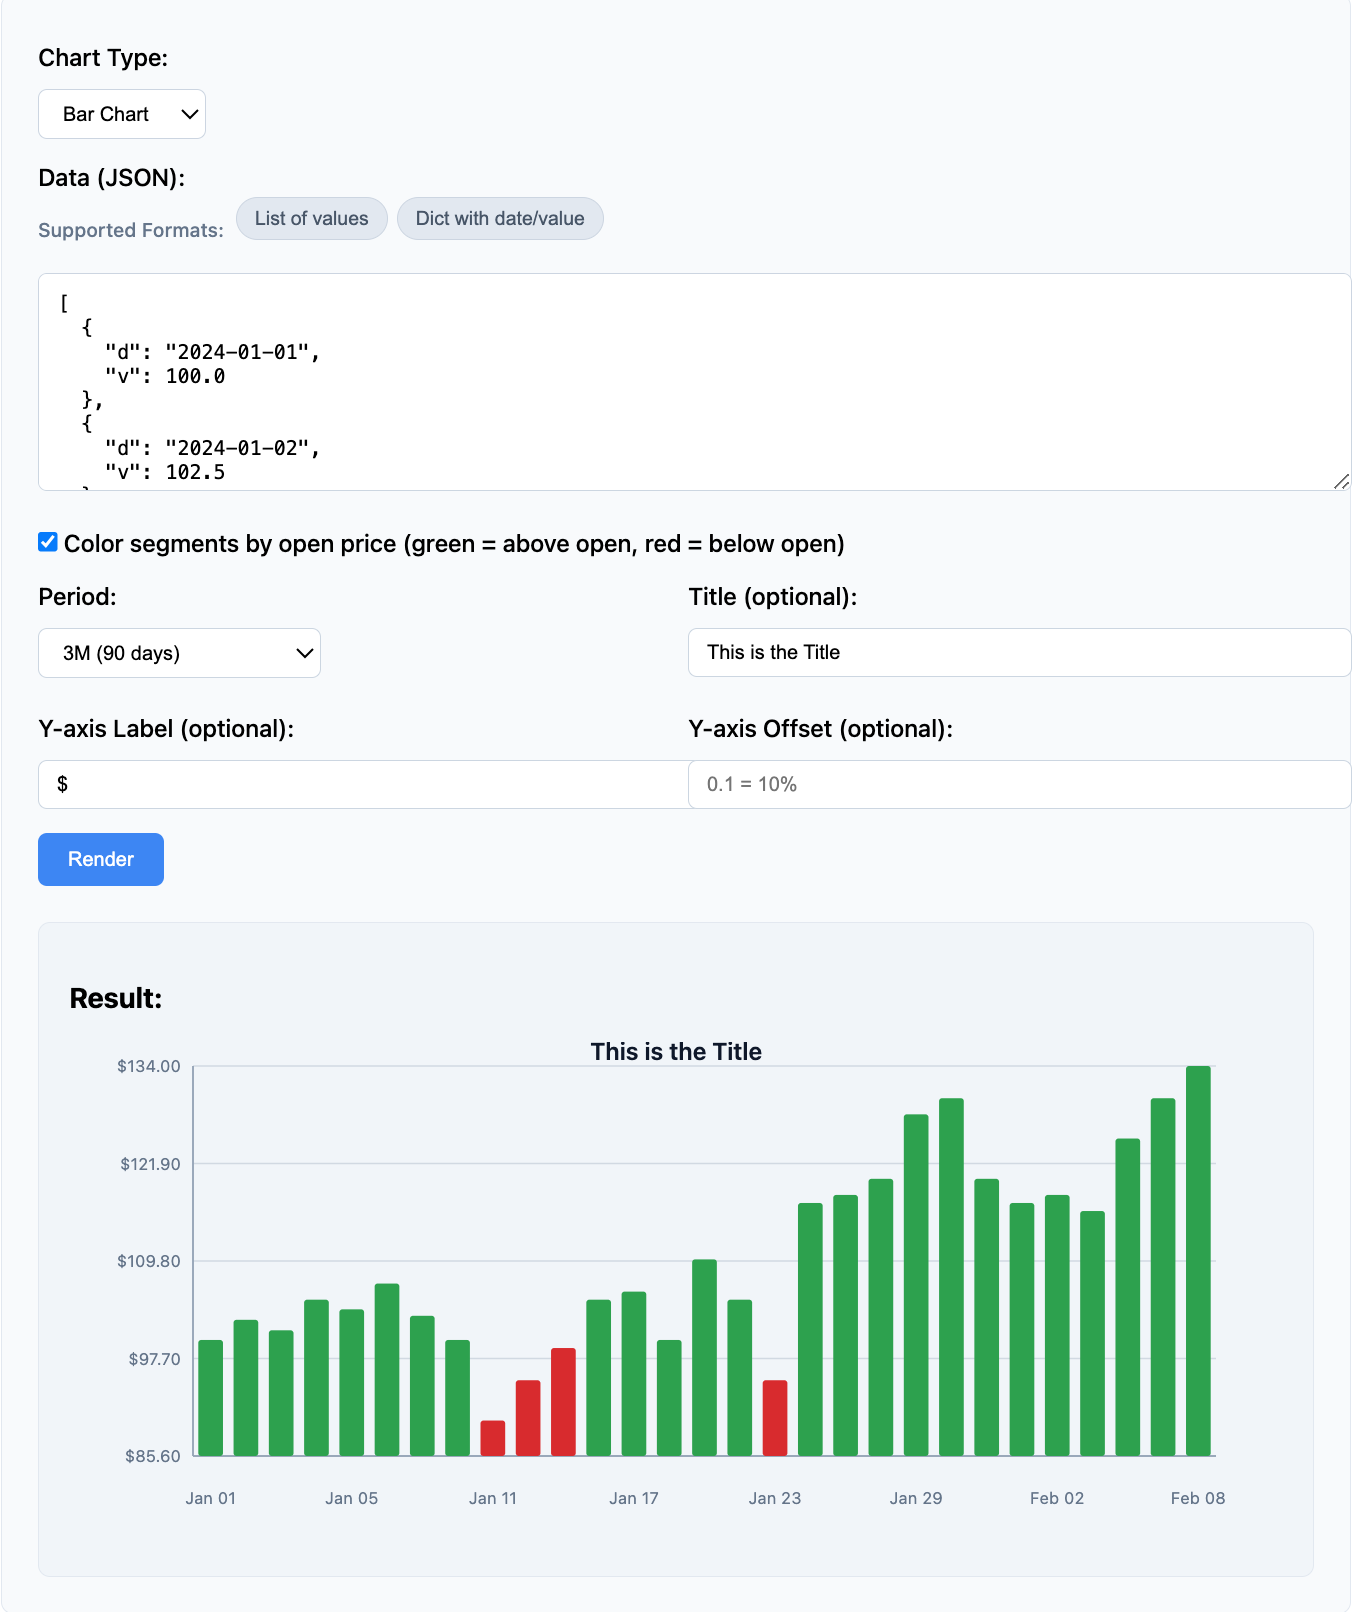
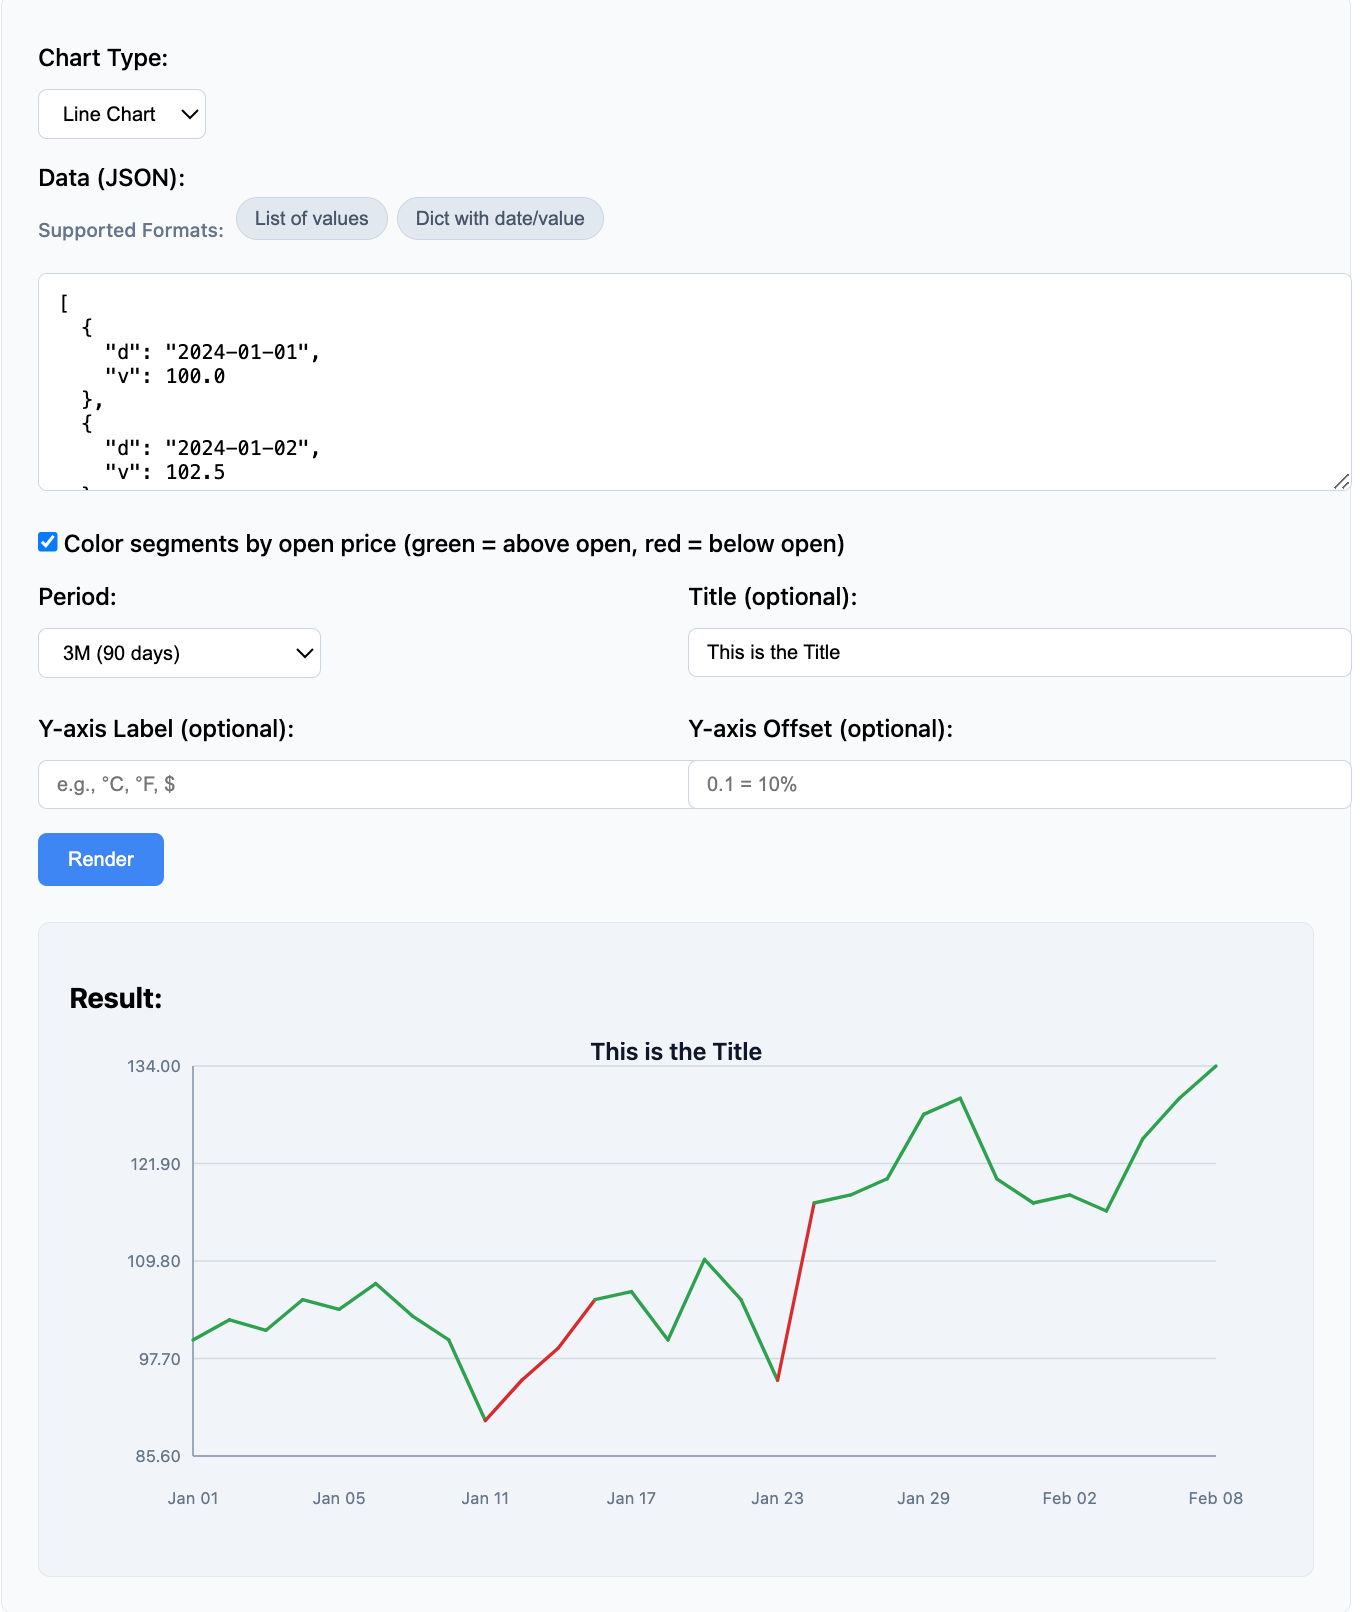
Includes an Interactive Test UI for testing data formats, period slicing, SVG output, and chart parameters.
Preview
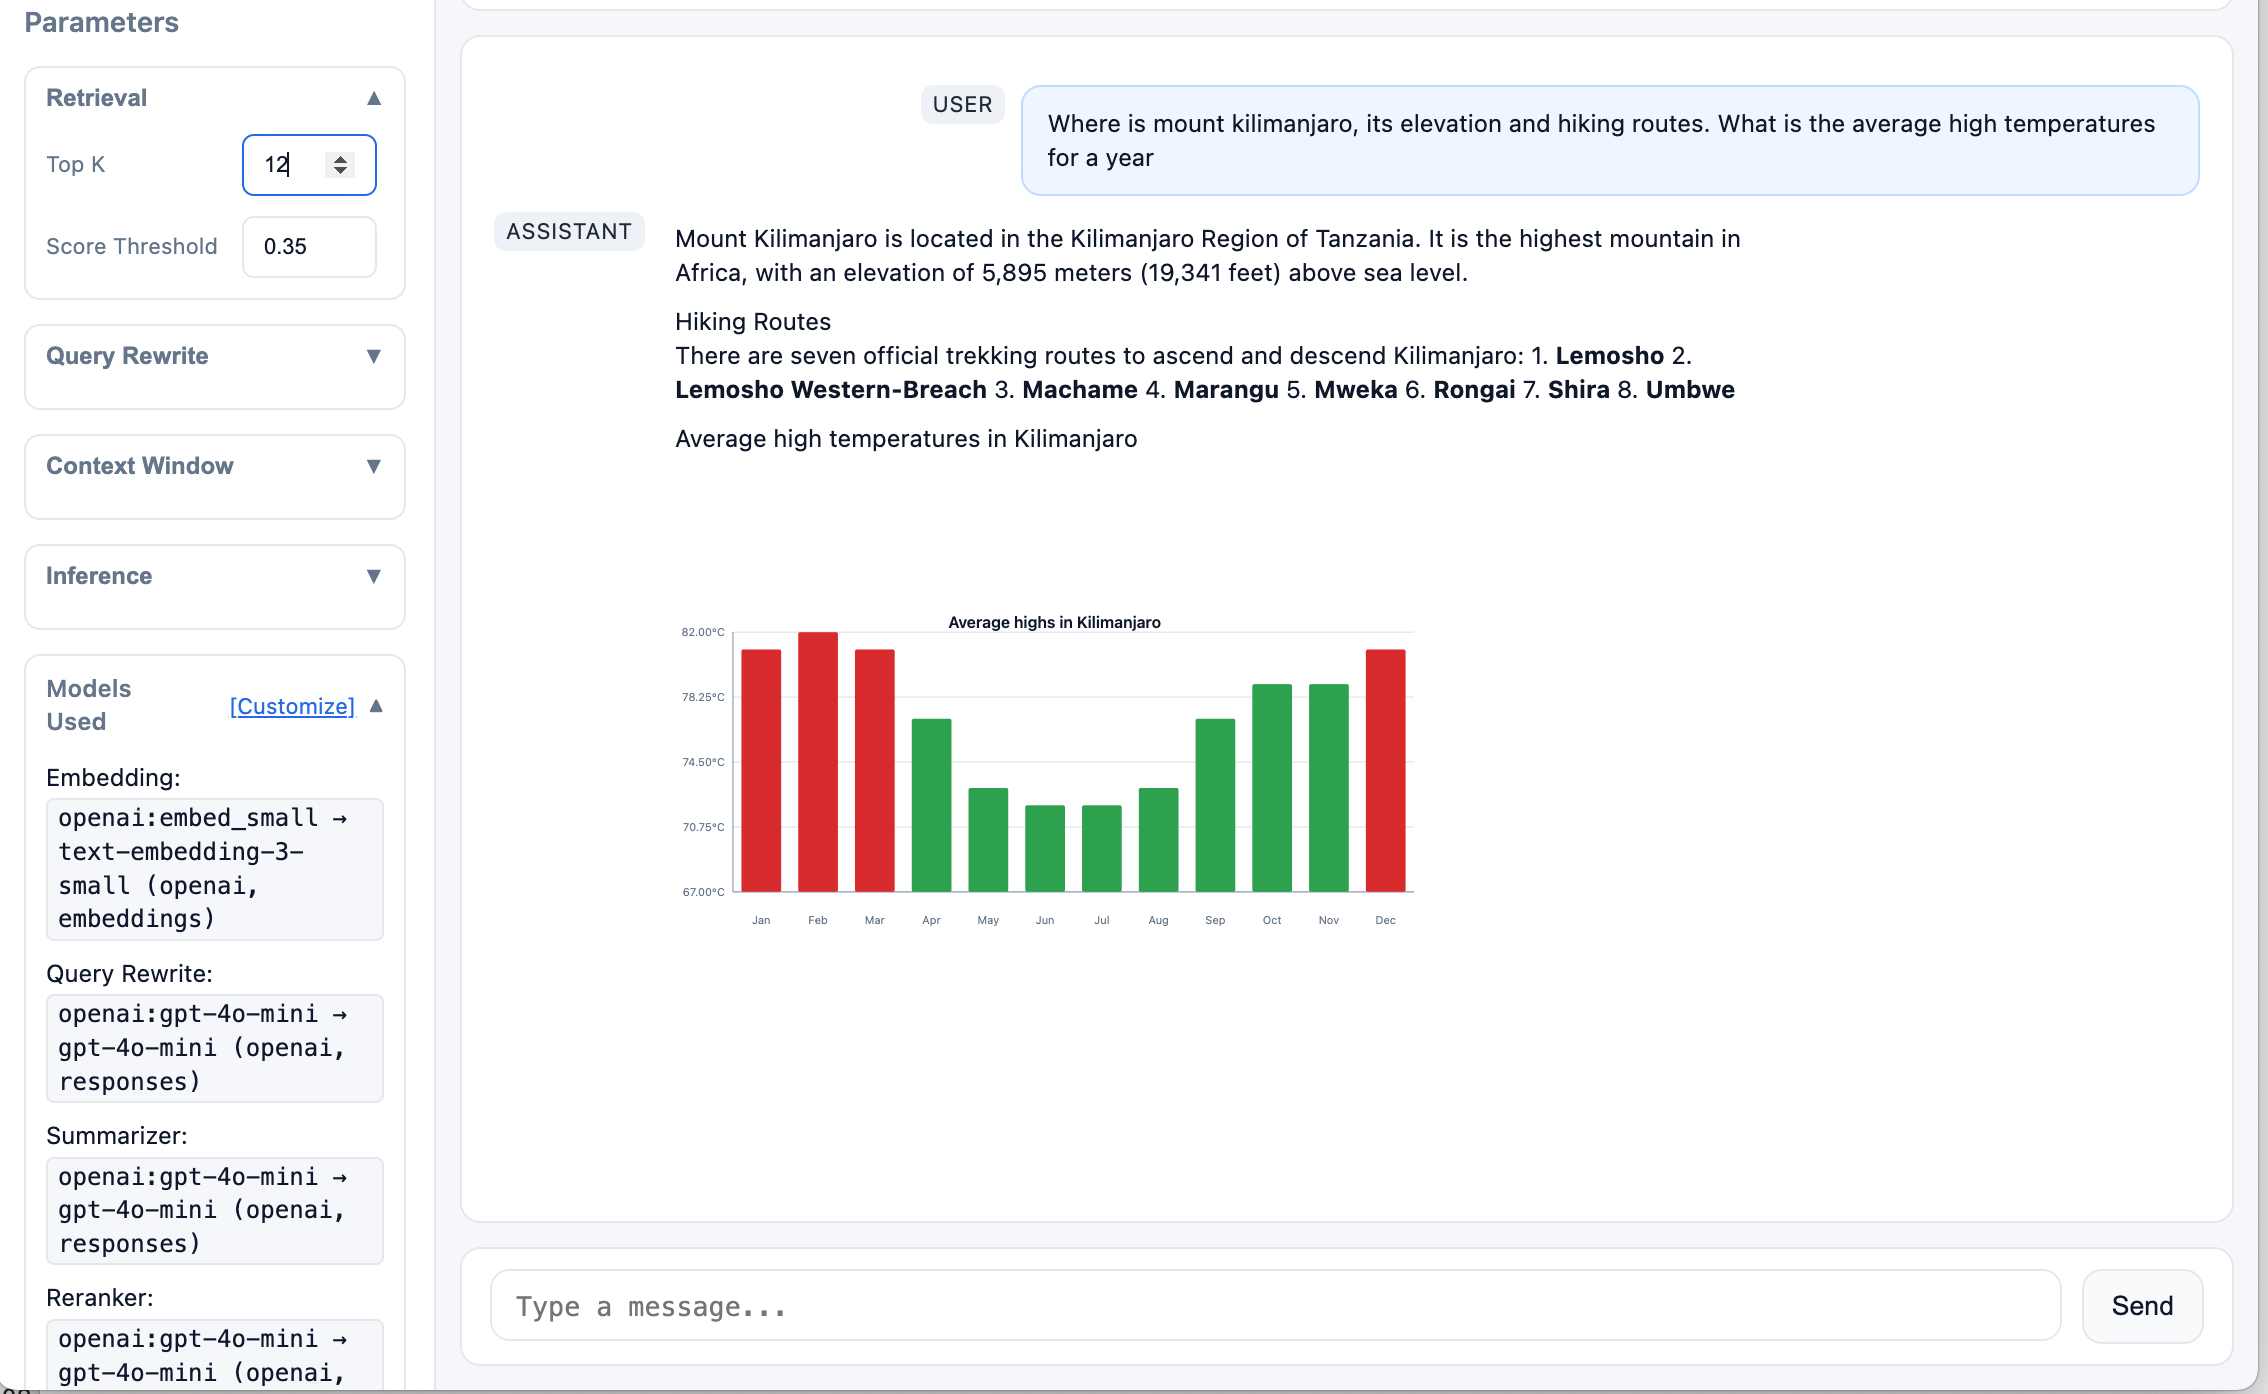
Example: an Agentic workflow returning a server-rendered SVG chart inside an LLM response.
Sparklines, bar charts, and slicable SVG time-series charts rendered server-side.
Use Cases
Use timeseries-sparklines when your backend, API, or Agentic workflow needs to turn time-series data into lightweight SVG charts without adding frontend charting dependencies.
- Agentic workflows: Generate SVG charts from tool results and embed them in chat, reports, dashboards, or generated HTML
- SSR and backend-rendered apps: Return ready-to-display SVG from Python backends, or expose it through an API for other stacks
- Operational dashboards: Render compact sparklines, trend lines, and mini charts for periodically refreshed data
- Chart and BI APIs: Accept slice parameters like
5D,1M,6M, or1Yand return SVG for downstream consumers - Reports, notebooks, and internal tools: Embed small trend visuals directly where HTML or SVG is supported
Example from a trading application:
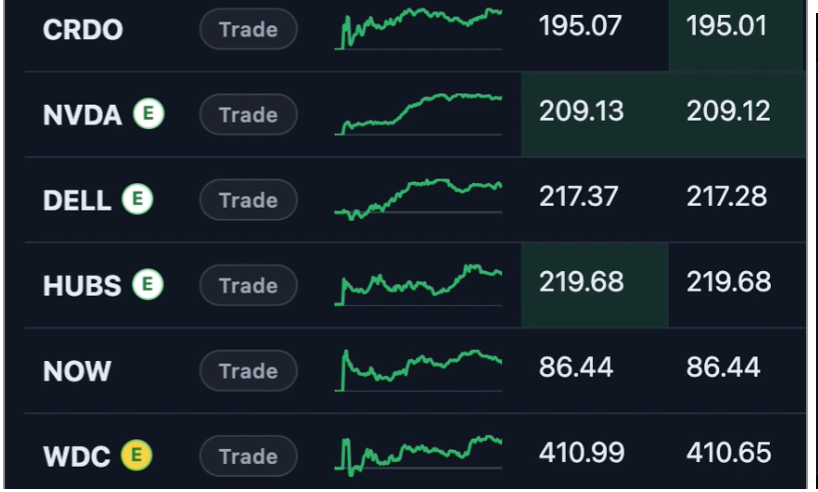
Dense sparklines for watchlist display
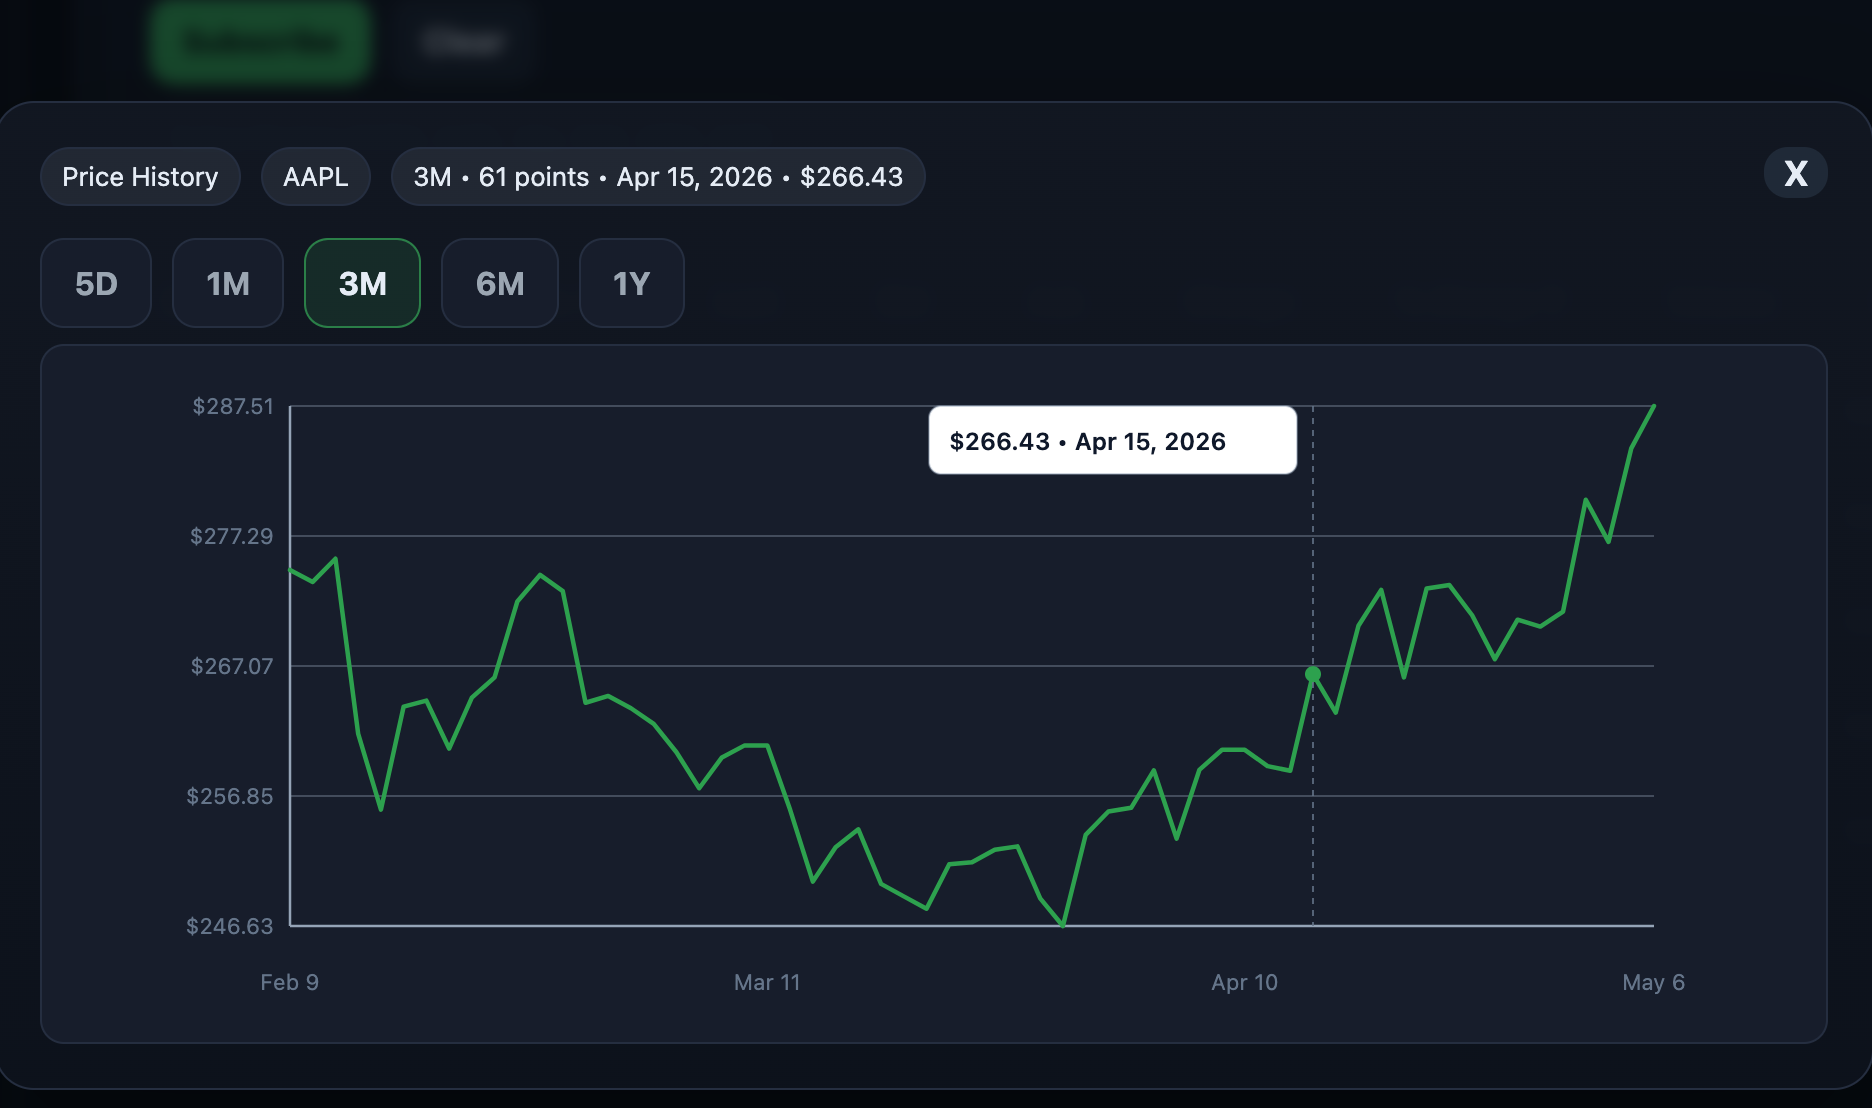
SVG charts with period slicing
System Architecture
The library acts as a server-side rendering harness that transforms time-series data into lightweight SVG visualizations for applications, APIs, dashboards, SSR workflows, and Agentic systems.
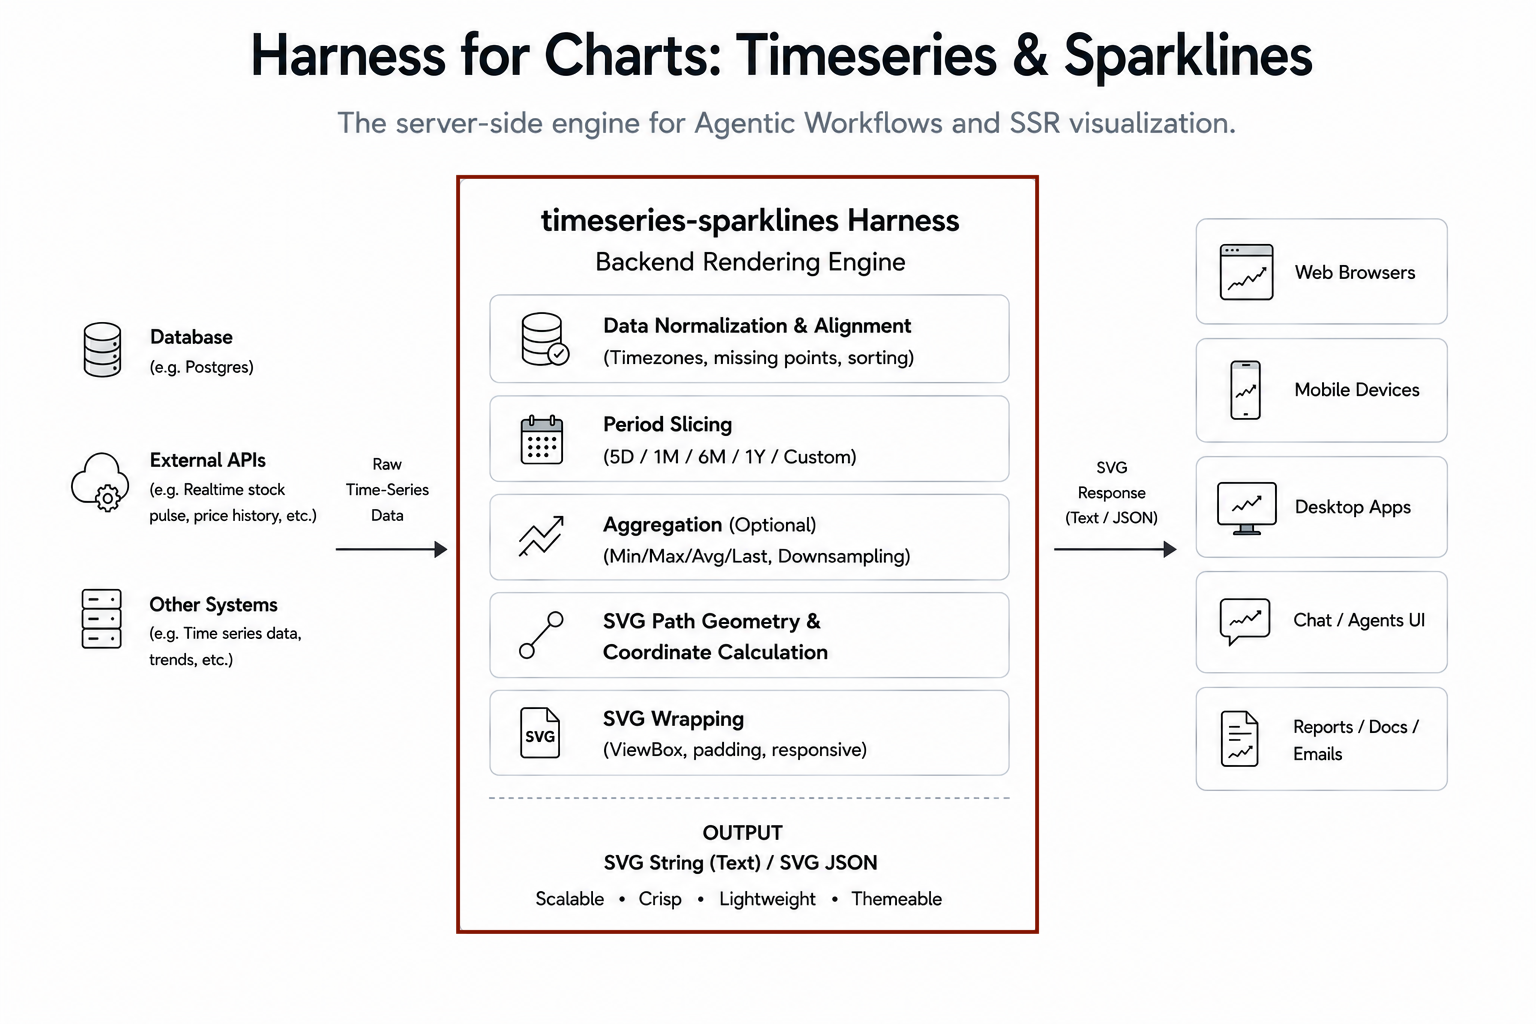
The harness handles normalization, slicing, coordinate calculation, and SVG generation.
Backend Rendering Harness
timeseries-sparklines can be used as a backend rendering harness inside APIs, dashboards, SSR applications, and Agentic workflows.
Typical flow:
- Retrieve time-series data from a database, API, cache, or tool
- Render a sparkline, bar chart, or time-series chart with a selected period
- Return SVG for embedding into dashboards, reports, notebooks, generated HTML, or chat interfaces
What you get
- Sparkline rendering - Compact sparklines, trend lines, and mini charts for inline display
- Bar charts - Vertical bar charts for time-series data with configurable bar width and colors
- Time-series charts - SVG charts with axis labels, grid lines, and period-based formatting
- Configurable styling - Customizable colors, dimensions, and formatting
- Data normalization - Accepts multiple input formats automatically
- Period slicing - Auto-filters to trading days based on period selection
- Segment coloring - Optional color-by-open rendering for trend visualization
- REST API server - FastAPI-powered rendering service
- Zero frontend chart runtime - Browser displays returned SVG directly
Install
pip install timeseries-sparklines
For the REST API server:
pip install "timeseries-sparklines[api]"
Quick example
Sparkline Example
from timeseries_svg import SparklineRenderer

data = [
    {"d": "2024-01-01", "v": 100.0},
    {"d": "2024-01-02", "v": 102.5},
    {"d": "2024-01-03", "v": 101.2},
    {"d": "2024-01-04", "v": 105.0},
]

renderer = SparklineRenderer(width=96, height=32)
svg = renderer.render(data)
print(svg)  # Returns SVG string
Chart Example
from timeseries_svg import TimeSeriesChartRenderer

data = [
    {"d": "2024-01-01", "v": 150.0},
    {"d": "2024-01-02", "v": 152.5},
    {"d": "2024-01-03", "v": 151.0},
    {"d": "2024-01-04", "v": 155.0},
    {"d": "2024-01-05", "v": 158.0},
]

renderer = TimeSeriesChartRenderer(width=760, height=320)
svg = renderer.render(data, period="5D", title="AAPL Price History")
print(svg)  # Returns SVG string
With custom y-axis label:
renderer = TimeSeriesChartRenderer(width=760, height=320, y_axis_label="$")
svg = renderer.render(data, period="5D", title="AAPL Price History")
Bar Chart Example
from timeseries_svg import BarChartRenderer

data = [
    {"d": "2024-01-01", "v": 65.0},
    {"d": "2024-02-01", "v": 68.0},
    {"d": "2024-03-01", "v": 72.0},
    {"d": "2024-04-01", "v": 75.0},
    {"d": "2024-05-01", "v": 80.0},
]

renderer = BarChartRenderer(width=760, height=320)
svg = renderer.render(data, period="1Y", title="Temperature by Month")
print(svg)  # Returns SVG string
With custom y-axis label:
renderer = BarChartRenderer(width=760, height=320, y_axis_label="°F")
svg = renderer.render(data, period="1Y", title="Temperature by Month")
Data Input Formats
The library automatically normalizes various input formats:
List of Dicts (Standard)
data = [
    {"d": "2024-01-01", "v": 100.0},
    {"d": "2024-01-02", "v": 102.5},
]
List of Lists
data = [
    ["2024-01-01", 100.0],
    ["2024-01-02", 102.5],
]
Dict with Date Keys
data = {
    "2024-01-01": 100.0,
    "2024-01-02": 102.5,
}
Simple Value List
data = [100.0, 102.5, 101.2]
# Dates auto-generated as "day-0", "day-1", etc.
Custom Keys
data = [
    {"date": "2024-01-01", "price": 100.0},
    {"date": "2024-01-02", "price": 102.5},
]
svg = renderer.render(data, date_key="date", value_key="price")
REST API Server
The package includes a FastAPI-powered REST API server for remote rendering:
# Install with API dependencies
pip install "timeseries-sparklines[api]"

# Run the server
timeseries-server
The server starts on http://0.0.0.0:9300 with endpoints:
POST /sparkline-raw- Render sparkline from JSON dataPOST /chart-raw- Render chart from JSON dataGET /health- Health check endpoint
Frontend Integration Pattern
For frequently refreshed sparklines, server-side SVG rendering works best when updates are periodic, cacheable, and backed by server-side caching rather than sub-second or tick-level.
For high-frequency streaming views, a hybrid approach is usually more efficient:
- Use
timeseries-sparklinesfor the initial sparkline render or SSR response - Batch multiple sparklines server-side when rendering many charts on one page
- Cache rendered SVGs or source data on the backend when multiple users request the same view
- Use WebSockets or incremental frontend updates for live changes
- Pause polling when browser tabs are inactive and refresh the full sparkline on wake-up or focus
This pattern works best when:
- Update frequency is moderate, such as 30-60 seconds for sparklines
- Many similar charts can share cached data or rendered SVG output
- Multiple sparklines can be batched into a single backend response
- The frontend mainly displays SVG and does not need heavy chart interaction
Value Proposition
Without timeseries-sparklines, you’d need to:
- Write SVG rendering code (calculate coordinates, scaling, paths)
- Normalize multiple data formats yourself
- Implement period-based slicing logic
- Calculate proper margins, axis labels, grid lines
- Handle date formatting for different periods
- Implement segment coloring logic
With timeseries-sparklines:
# One line to render
svg = renderer.render(data, period="1M", color_by_open=True)
You provide the time-series data; the library handles SVG rendering and coordinate calculations.
Summary
timeseries-sparklines is a lightweight server-side SVG rendering engine for sparklines, bar charts, and slicable time-series charts.
It is designed for dashboards, SSR applications, APIs, reports, and Agentic workflows that need lightweight SVG visualizations without shipping frontend charting libraries.